Hands down, no doubt, the most common business mistake creative entrepreneurs (and almost all entrepreneurs) make is not taking time to track and understand the metrics of their business. The true language of business is numbers…data. Numbers can tell you where your business is today. Numbers can predict the future of your business. Numbers help you see where you need to change and improve. Business is all about the numbers.
 About a year into growing my agency, I became obsessed with tracking the data of my business. I opened a blank spreadsheet and started to put all of the data points I would start to track. The list became “Mike Janda OCD Large” and it included A TON of things including:
- How much did we bill (revenue)?
- How much did we cost (expenses)?
- How much profit (or loss) did we make?
- How many proposals did we submit?
- What was the average cost per proposal?
- How many proposals were green lit?
- What was the average cost per proposal that received a green light?
- How many invoices did we send?
- What was the average cost per invoice?
- How much money are we waiting to collect (receivables)?
- How much money is overdue for payment?
- How many man-hours did it take to complete our projects this month?
- How much did we cost per production hour (the hourly burn rate)?
- How much did each employee cost per hour/per day?
- How much money is in each account at the end of the month?
- How many days before the first of the month did we have enough money green lit to cover costs?
- How many working projects do we have that have yet to be invoiced?
- Who were our first-, second-, and third-largest clients in the month (based on dollars billed)?
- How much did we spend on advertising this month?
- What were our payroll costs?
- How much were overhead costs (excluding payroll)?
- When did employees receive raises and how much did that amount to?
With the right data, you can predict the future by looking at the past.
I tracked those data points for the next 12 years until I sold my agency in 2015. I still have the spreadsheets and can tell you the answer to any of those questions for any month of my business for the 144 months I tracked them. Yup. I have a data passion problem (and you should too).
After a couple years of watching the trends I started to recognize which data points were the most valuable to my business and I focused most of my attention on those. Are you interested tracking your business data? Here are the data points that are the most valuable for you to start watching:
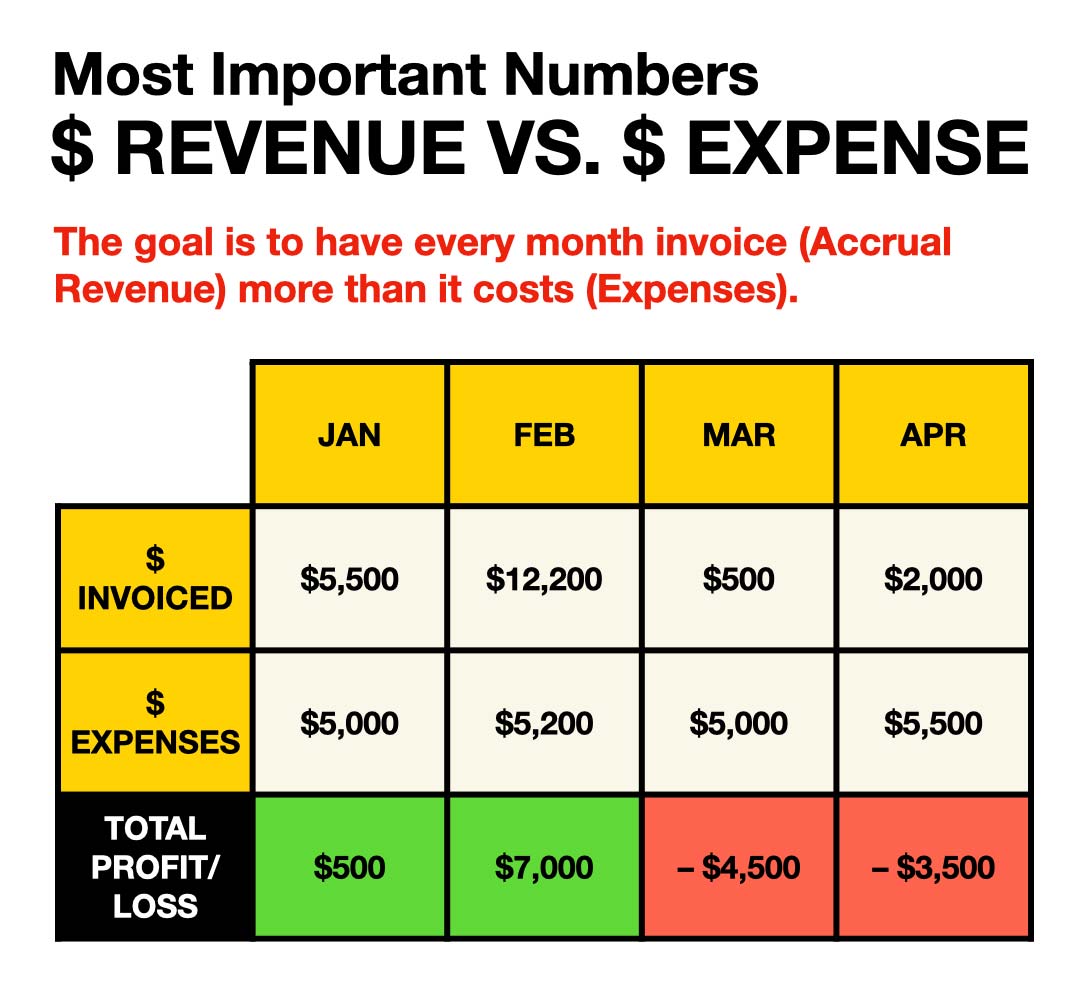
Revenue vs. Expense
Each month track the amount of money your business invoiced vs. the amount of money your business cost. Make a goal to always invoice more than you spend (i.e. show a profit every month). A profitable year is not an accident and it shouldn’t be a surprise. In the 13 years running my agency before sale, I never had an unprofitable year. I believe that my focus on monthly profitability, tracking my revenue vs. my expenses was THE REASON that I always showed a profit at year end, every year for 13 years.
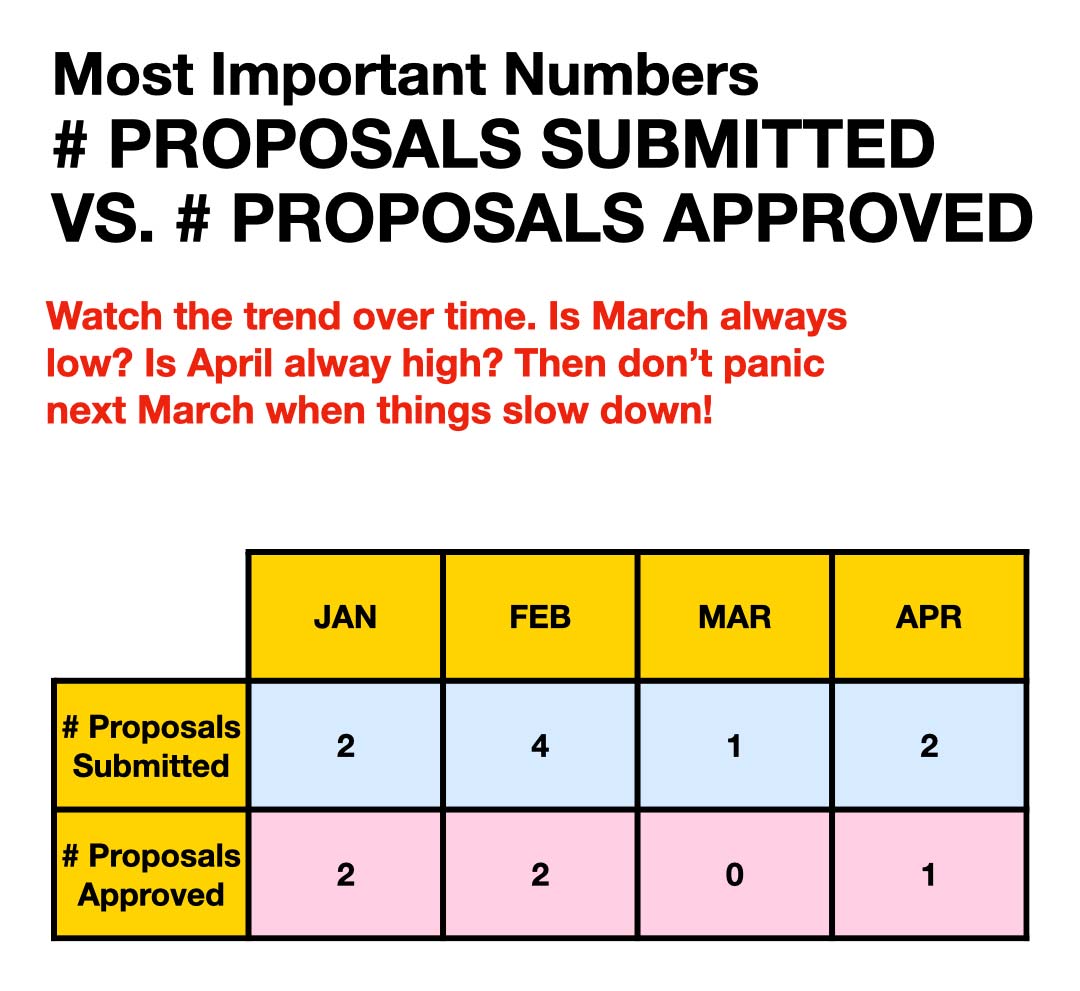
 Proposals Submitted vs. Proposals Approved
Track the number of proposals you submit to clients vs. the quantity of proposals you win. This data will help reveal trends in your business. You will begin to see that certain months have more proposals, year after year, and other times of the year have less proposal requests from clients. Knowing these trends in your business will help keep you from panicking when things slow down. Also, dividing the number of proposals approved by the number of proposals submitted will reveal your average win rate percentage. For example, if you submit 5 proposals in a month and you win 4 of them, your win rate percentage is 80% (4 divided by 5 = 80%).
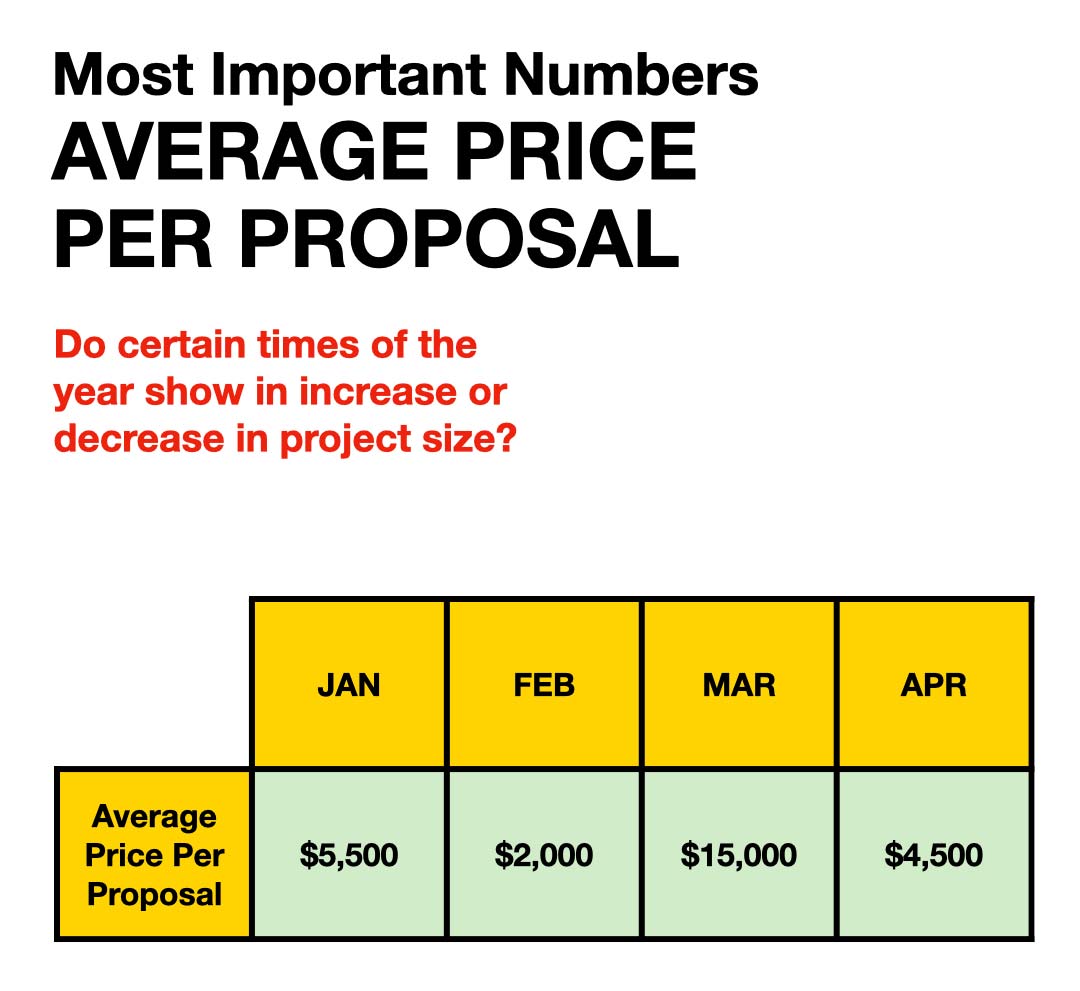
 Average Price Per Proposal
Each month, add together the total value of proposals you submit and divide by the number of proposals you submitted to reveal your average price per proposal. This data will help you calculate the number of projects you need to pitch and win at your average price in an effort to hit your annual revenue goals. If your average price per proposal is $2,500, and you want to bill $100,000 in a year, you need to win 40 projects (40 x $2,500 = $100,000). And if your average win rate percentage is 80%, then you will need to submit 50 proposals, which should create 40 wins at your average price of $2500 and yield a total annual revenue of $100,000. In summary, you need 4-5 proposals per month to stay on track toward your goal. If you get to March and you don’t have 12-15 proposals submitted, then your annual goal may already be in jeopardy. Time to get selling.
 These three data categories were by far the most valuable in helping me understanding my business. I go into a lot of detail on tracking and understanding your business metrics in Course 06 of my freelance course. But this is a good start for you and should get you headed in the right direction.
Do you know the answer to these questions?
- How much money do you invoice each month?
- How much money do you cost each month?
- How many proposals do you submit each month?
- How many proposal do you win each month?
- What is your average price per proposal won each month?
- What is your project win rate percentage?
- How many proposal opportunities do you need to have each year to hit your annual revenue goal?
- How are you tracking toward your goal, right now in this year?
Not knowing the data of their business is the biggest mistake most entrepreneurs make. Your numbers tell the story of your business, past, present, and future. It is time for you to get out a couple blank spreadsheets!